

Once you have your current state model, what do you do with it? How do you share it with the Process Owner and Executive Sponsor and spark their interest? My experience is that executives looking at a model that is 30 to 60 steps long are impressed and say something like, “Wow, that process is complex. I can see it has a lot of steps which could take a long time.” But they are not interested in reviewing every single step and getting into the details.
After documenting the current state process the business process improvement (BPI) team begins Analysis. It looks at where the problems are in the model (often categorizing them using the 8 wastes), it gathers quantitative data about the size and frequency of these problems, it measures cycle time and how long each step and wait is, and it gathers voice of the customer data. This information provides detail for the model. And putting this data on the current state model using icons, text, and symbols turns the current state map into a treasure map, which I call the Visual Analysis Map. Executives will be intrigued and offer their perspectives as you talk about it with them.
Let’s look at some examples. First a very simple Visual Analysis Map. This map was created on a large piece of butcher paper using stickies and dots. Different colors represent pain points that employees identified (green), quality problems (orange), and risks (red). After the team puts the symbols on the map, the BPM Facilitator asks the BPI team to discuss what they see on the map and comment about clusters of icons, and common themes.

It doesn’t matter that you can’t read all the steps and items on this image; you get the concept. And the team and executive can read them.
Here’s another map with a few keys icons on the Visio process diagram.

Here the green ovals name the type of waste and the pink hexagons give actual data. I have teams put quantitative data on the map where the information is useful to identify extent of a problem that relates to the improvement targets. Waiting is a waste that shows up in four of the ovals and so is a common challenge. Obviously from here the team needs to discuss root cause to see what’s underneath the problem and begin thinking about solutions.
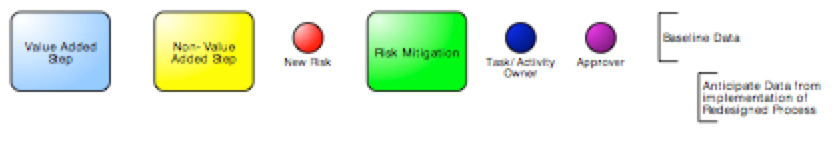
Below is another Visual Analysis map using BPMN. The legend below the map shows that steps are color-coded non-value added (yellow) and value added (blue), a red dot is used for a risk, a green rectangle shows the risk mitigation and blue (task owner) and purple (approver) dots show different roles.

Visual Analysis Maps will look different depending on whether one person creates them or the team does it. With one person putting the symbols on the map you often do not see the cluster effect, because one person just notes each waste once. When a team adds stickies there will be a cluster effect as different members will see multiple wastes at one step and there may be duplication of the same type of wastes.
Here is another map, which has nine color-coded items in the legend and each is marked on the map. Again the specifics are totally unreadable to us. The documenter has used color-coded ovals to show where the problems and opportunities occur and you can see the “clusters” at the steps where there is more than one oval.

How to use these Visual Analysis Maps with Executives. The teams I work with have a few milestone touch points (usually a one hour meeting) with the Process Owner and Executive Sponsor during the BPI process effort. Here with a Visual Analysis Map, they point out key problem areas that relate to the process improvement targets. They talk about how one problem area impacts another area. They explain quantitative data that shows the size of this problem area. They note how many hours of rework occur from the missing information and how that missing information causes further rework areas of the map. Instead of just looking at a process diagram on 60 steps the executive can see the critical few areas where improvements will be important. Ask the executive what s/he thinks. What ideas do they have about why these problems are occurring or what ideas do they have as possible solutions.
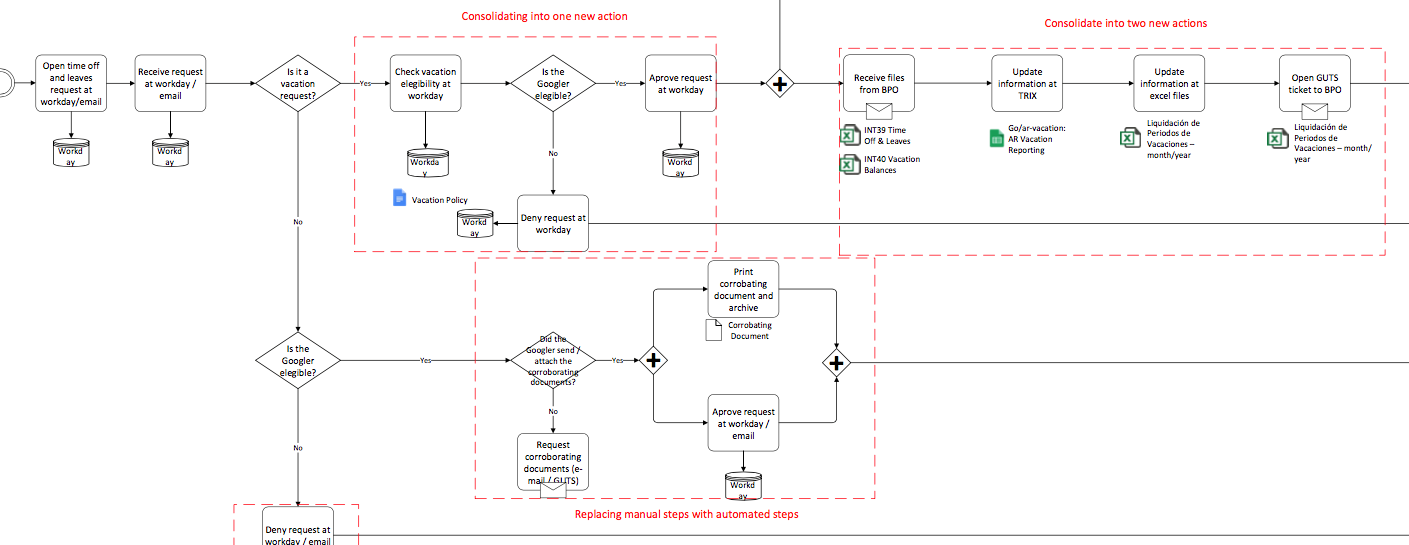
Here’s another way this technique can be helpful: use visual analysis to show planned changes in the future state. Use them to show where improvements will go to replace the current process. Use data text annotations to show baseline data and estimated future data after improvements are implemented. Below is a map in BPMN where dashed red boxes show steps that are being consolidated and ones that will be automated in the future state model.
Visual Analysis is a method of putting the analytical data, pain and waste classifications, customer input, time, risks and other elements on the current state model. This holistic graphic helps see patterns and identify focus areas. It is a wonderful way to engage the team and executives. I challenge you to use it and come up with your own visual techniques and dialog questions.
There are no products in your shopping cart.
| 0 Items |
Membership at BPMInstitute.org includes access to our other communities
![]()
![]()


I really appreciate this
Great description of the